The Milwaukee Bucks won 46 games in 2009-10. This result was a surprise to the pundits, who expected the Bucks to be among the worst in the NBA. So how is it the NBA came to “Fear the Deer”?
Ty Willihnganz at Courtside Analyst summarized Milwaukee’s 2009-10 season last April with the following comment: Berri and I and BucksNation were all right
Last night the Milwaukee Bucks clinched a playoff spot.
On October 29, 2009, a certain author of a certain book you ought to purchase and read sent me the following email, Subject lined “Bucks forecast?”:
Hi Ty,
What is your forecast for the Bucks right now? Still think they are going to be good? The consensus is they are very bad, but I don’t see that in the numbers.
I didn’t see it in the numbers either. And I said so at the time. And the readership here was with me, and now we have been vindicated.
Skiles rules, the Bucks rule, and BucksNation rules. And this should teach us all something about the reliability or credibility of the national press corp.
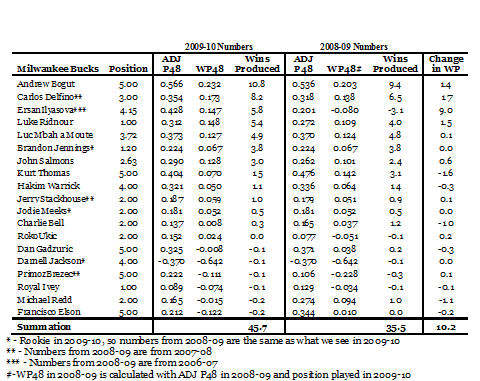
In the summer of 2009, the pundits argued the Bucks would be one of the worst teams in the NBA. Ty and I thought otherwise. And when you look at the numbers from 2009-10 – in the table below — you can see why Ty and I did not think the Bucks were going to be among the NBA’s worst last year:

A simple look at the past numbers suggested that the Bucks would win about 35 games last year. And this forecast is artificially low because the only numbers we had on Ersan Ilyasova were from 2006-07 (his only prior NBA season when he was quite bad).
Why did the pundits think the Bucks were going to be extremely bad? Once again the problem is with the perception of scoring. The Bucks only won 34 games in 2008-09. And then Richard Jefferson (19.6 points per game) and Charlie Villanueva (16.2 points per game) departed. Furthermore, Michael Redd (21.2 points per game) was injured and there was some question if he could play the entire season (he ultimately only played in 18 games). With all these scorers departing (or not contributing), the pundits thought a 34 win team was about to get much worse.
Ultimately the leading scorer on the Buck was John Salmons (19.9 points per game). But Salmons wasn’t there at the beginning of the season. If you look at the players who were there from the beginning, the leading scorer was Andre Bogut. And Bogut only averaged 15.9 points per game. So as the pundits expected, the Bucks did not have a dominant scorer for much of the season. Still, this team was not horrible.
To understand why, we need to look at all the stats (via Wins Produced). And when we take this step it was clear the Bucks were not going to be horrible in 2009-10. Bogut, Carlos Delfino, Luke Ridnour, and Luc Mbah a Moute had all been productive players in 2008-09. And since NBA players (relative to what we see in the NFL and MLB) are quite consistent across time, it was reasonable to expect these players to produce win in 2009-10.
That is what happened. This quartet produced 29.4 wins last year. So even if we only look at these four players, we would have expected the Bucks to be better than the 14th best team in the Eastern Conference (where ESPN.com placed the Bucks) or the 28th best team in the NBA (where Chris Mannix at SI.com ranked the Bucks).
What about this next year? The pundits have seen the Bucks were a playoff team last year. And the Bucks have not lost any major scorers. So the pundits seem to think the Bucks will be about what they were last year.
What if we turn to Wins Produced? As the Bucks story last year demonstrated, forecasting the NBA is easy. Right?
Well, before we get too smug, let’s look at some forecasts.
Let’s start by noting that this year the pundits and Wins Produced seem to agree with respect to the Bucks. Ty Willihnganz projected the Bucks twice (see HERE and HERE) and each time concluded the Bucks can expect to win about 46 games in 2010-11.
Ian Levy – at Hickory High (the latest member of the Wages of Wins Network — and past contributor in this forum) — utilized Wins Produced to forecast every team in the NBA.

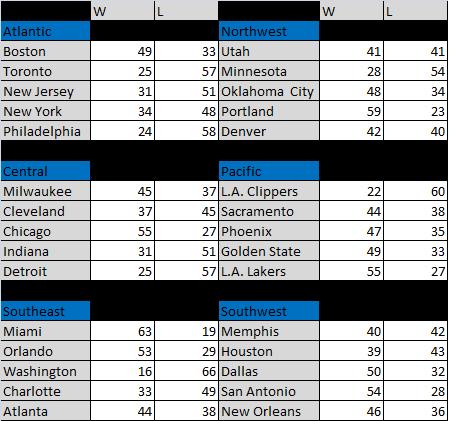
As you can see, Ian concludes the Bucks can expect to win 45 games next year (Ian also has an Expected Point metric that looks quite interesting – and I hope to talk about this in the future).
Ian is not the only one to use Wins Produced to forecast this next season. Arturo Galletti is also busy forecasting. And his latest (he is offering various versions) says the Bucks can expect to win 39 games. So Arturo expects the Bucks to decline a bit.
Six or seven wins, though, are not that big of a difference. An injury here or there can easily cause a team to decline by this amount. Likewise, if Brandon Jennings improves (young players do this) then the Bucks can be better than Arturo expects.
One should note that Ty, Ian, and Arturo are not the only people who will be forecasting this next season. And what we see from just these three forecasts is that even if people mostly agree on how basketball should be analyzed, forecasts will still differ somewhat.
Maybe it would be better to do something similar to what Chad Ford does for the NBA Draft at ESPN.com. Rather than forecast exact draft position, Ford focuses on Tiers. In other words, some players are Tier 1, others are Tier 2, etc. One would expect the players in the first Tier to be taken before the second Tier, but within Tiers it is hard to forecast.
Looking back at Ian’s forecast, one can argue the NBA breaks down into the following Tiers:
Tier 1 (championship contender – 55 or more wins): Miami, Portland, LA Lakers, and Chicago
Tier 2 (homecourt playoff contender – or 45 to 54 wins): Orlando, Boston, Milwaukee, San Antonio, Dallas, Golden State, Oklahoma City, Phoenix, and New Orleans
Tier 3 (possible playoff contender – or 35 to 44 wins): Atlanta, Cleveland, Sacramento, Denver, Utah, Memphis, and Houston
Tier 4 (top lottery team – or 25 to 34 wins): New York (could be playoff team in weak East), Charlotte, Indiana, New Jersey, Minnesota, Detroit, and Toronto
Tier 5 (bottom lottery team – or less than 25 wins): Philadelphia, LA Clippers, and Washington
Again, this is based on Ian’s foreacasts. If we use Arturo’s forecast, we see…
Tier 1: Miami, Portland, LA Lakers, San Antonio, and Boston
Tier 2: Chicago, Orlando, Utah, Atlanta, Dallas, Golden State, New Orleans, and Denver
Tier 3: Oklahoma City, Phoenix, Sacramento, New Jersey, Milwaukee, Houston, Memphis, Cleveland, Charlotte
Tier 4: New York, Detroit, Toronto
Tier 5: Minnesota, Indiana, LA Clippers, Philadelphia, and Washington
Okay, there are some similarities. But there are clear differences also. And again, Arturo and Ian are using the same basic idea to forecast the teams (so maybe the Tier idea doesn’t really work).
All of this illustrates something that I think needs to be emphasized. Even if we agreed on how to evaluate the past, projecting the future is still not going to be something we all agree upon.
And it also illustrates how I think that people looking to “test” Wins Produced might need to think of other tests. For example, one could consider…
1. Is there a clear theory behind the model (this is not the same as … does the model produce results consistent with your prior beliefs)?
2. How well does the model explain what it purports to explain?
3. How consistent is the model across time?
And these are just some of the issues to consider. For a semi-complete guide one could consider something I wrote about three years ago.
- DJ
![]()